Usage logs and statistics
What Aimogen Pro records for every AI request, the graphs and per-chatbot reporting, and the retention settings that keep the tables manageable.
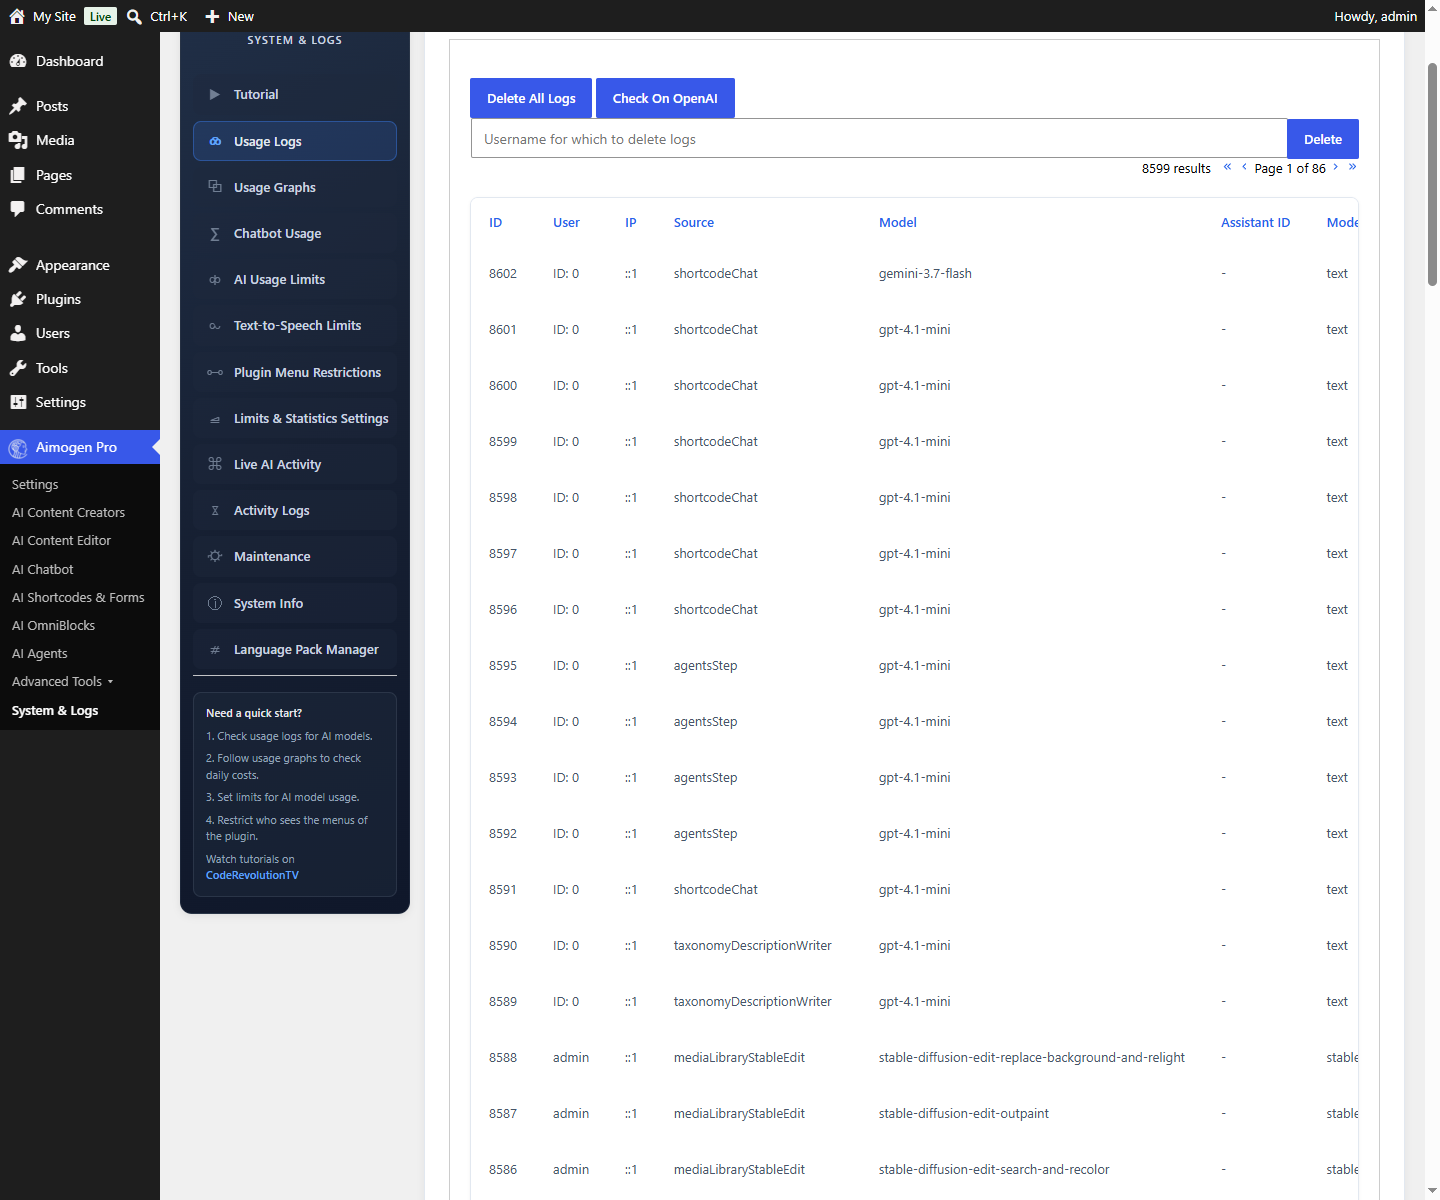
Usage Logs#
One row per API request, in {prefix}aiomatic_logs:
| Column | Contains |
|---|---|
userId | Who made it, where known |
ip | Their IP |
session | Session identifier |
model | The model used |
assistant_id | The assistant, if any |
mode | Request mode |
units | Tokens or units consumed |
type | Unit type |
price | Estimated cost |
env | Which feature made the request |
tags | Tags |
apiRef | Provider reference |
time | When |
env is the column that makes this useful. It identifies the feature — a chatbot request, a bulk rule,
a PHP API call with your own label, the Playground. Filtering by it tells you which feature is spending
your budget.
Enabling it#
Settings › Statistics
| Setting | What it does |
|---|---|
Enable Usage Tracking | Records the row. Leave this on |
Enable Detailed Usage Tracking | Also stores prompt and response text in aiomatic_logmeta |
Usage Graphs#
The same data plotted: call count, token count, cost and generated image count over time. Useful for spotting the day a change made costs jump.
Chatbot Usage#
Added in 2.8.8. Total tokens and words per chatbot over a chosen period — today, the last 7 or 30 days, this or last month, or a custom range.
Activity Logs#
A different log: one entry per rule execution, recording what ran and what failed. This is where the provider error text appears in full.
Enable it with Enable Logging (Settings › General Settings). Enable Detailed Logging adds
verbose entries.
The log file location is shown on the Maintenance tab.
Prices are estimates#
The price column is calculated from the plugin internal model price table. It is close, and good for
relative comparison between features and over time.
It is not your invoice. Provider pricing changes, and the table is compiled per release. Treat your provider dashboard as authoritative.
Retention#
Logs grow. On a busy site with detailed tracking, aiomatic_logmeta grows fastest.
| Setting | Where | What it does |
|---|---|---|
Auto Clear Logs | Settings › General Settings | Schedules the aiomaticactionclear event on the chosen interval |
| Retention options | Limits & Statistics Settings | What is kept and for how long |
Delete Logs | Maintenance | Clears them now |
Set a retention policy on any production site. See Maintenance and cleanup.
Reading the logs#
"What did last month cost?" Usage Graphs, or Usage Logs summed by date.
"Which feature is expensive?" Group Usage Logs by env.
"Which user is consuming the budget?" Group by userId and ip. If every request shows the same IP,
your CDN is masking it — see the aiomatic_get_ip filter.
"Why did that rule fail?" Activity Logs, then match the error against API and provider errors.
"Was a request even made?" If Activity Logs shows a rule ran but Usage Logs has no row, the failure happened before the API call — usually configuration.
Programmatic access#
The aiomatic_get_items filter receives log query results, so you can adjust or export them. See
Filter reference.
The tables are documented in Data model if you need to query them directly.
Common problems#
Usage Logs is empty. Tracking is off, or logs were cleared.
Prices show as zero. The model is not in the price table — common with custom endpoints and newly added models.
The database is growing quickly. Detailed tracking plus no retention policy.
Every request shows the same IP. A CDN or reverse proxy. Fix with the aiomatic_get_ip filter.
Related#
Still stuck? Open a support ticket and include the diagnostics from Aimogen Pro › System & Logs › System Info.